── Attaching core tidyverse packages ──────────────────────── tidyverse 2.0.0 ──
✔ dplyr     1.1.4     ✔ readr     2.1.5
✔ forcats   1.0.0     ✔ stringr   1.5.1
✔ ggplot2   3.5.1     ✔ tibble    3.2.1
✔ lubridate 1.9.3     ✔ tidyr     1.3.1
✔ purrr     1.0.2
── Conflicts ────────────────────────────────────────── tidyverse_conflicts() ──
✖ dplyr::filter() masks stats::filter()
✖ dplyr::lag()    masks stats::lag()
ℹ Use the conflicted package (<http://conflicted.r-lib.org/>) to force all conflicts to become errorsR programming for beginners (GV900) ~ Solutions
Lesson 4: Practice exercises
Homework
Setup
Homework
- How many rows are in penguins? How many columns?
Solution: The following three functions will tell the dimensions and of the dataset.
Rows: 344
Columns: 8
$ species           <fct> Adelie, Adelie, Adelie, Adelie, Adelie, Adelie, Adel…
$ island            <fct> Torgersen, Torgersen, Torgersen, Torgersen, Torgerse…
$ bill_length_mm    <dbl> 39.1, 39.5, 40.3, NA, 36.7, 39.3, 38.9, 39.2, 34.1, …
$ bill_depth_mm     <dbl> 18.7, 17.4, 18.0, NA, 19.3, 20.6, 17.8, 19.6, 18.1, …
$ flipper_length_mm <int> 181, 186, 195, NA, 193, 190, 181, 195, 193, 190, 186…
$ body_mass_g       <int> 3750, 3800, 3250, NA, 3450, 3650, 3625, 4675, 3475, …
$ sex               <fct> male, female, female, NA, female, male, female, male…
$ year <int> 2007, 2007, 2007, 2007, 2007, 2007, 2007, 2007, 2007…[1] 344 8tibble [344 × 8] (S3: tbl_df/tbl/data.frame)
$ species : Factor w/ 3 levels "Adelie","Chinstrap",..: 1 1 1 1 1 1 1 1 1 1 ...
$ island : Factor w/ 3 levels "Biscoe","Dream",..: 3 3 3 3 3 3 3 3 3 3 ...
$ bill_length_mm : num [1:344] 39.1 39.5 40.3 NA 36.7 39.3 38.9 39.2 34.1 42 ...
$ bill_depth_mm : num [1:344] 18.7 17.4 18 NA 19.3 20.6 17.8 19.6 18.1 20.2 ...
$ flipper_length_mm: int [1:344] 181 186 195 NA 193 190 181 195 193 190 ...
$ body_mass_g : int [1:344] 3750 3800 3250 NA 3450 3650 3625 4675 3475 4250 ...
$ sex : Factor w/ 2 levels "female","male": 2 1 1 NA 1 2 1 2 NA NA ...
$ year : int [1:344] 2007 2007 2007 2007 2007 2007 2007 2007 2007 2007 ...- What does the bill_depth_mm variable in the penguins data frame describe? Read the help for ?penguins to find out.
Solution:
bill_depth_mm: a number denoting bill depth (millimeters)
- Make a scatterplot of bill_depth_mm vs. bill_length_mm. That is, make a scatterplot with bill_depth_mm on the y-axis and bill_length_mm on the x-axis. Describe the relationship between these two variables.
Solution:
Warning: Removed 2 rows containing missing values or values outside the scale range
(`geom_point()`).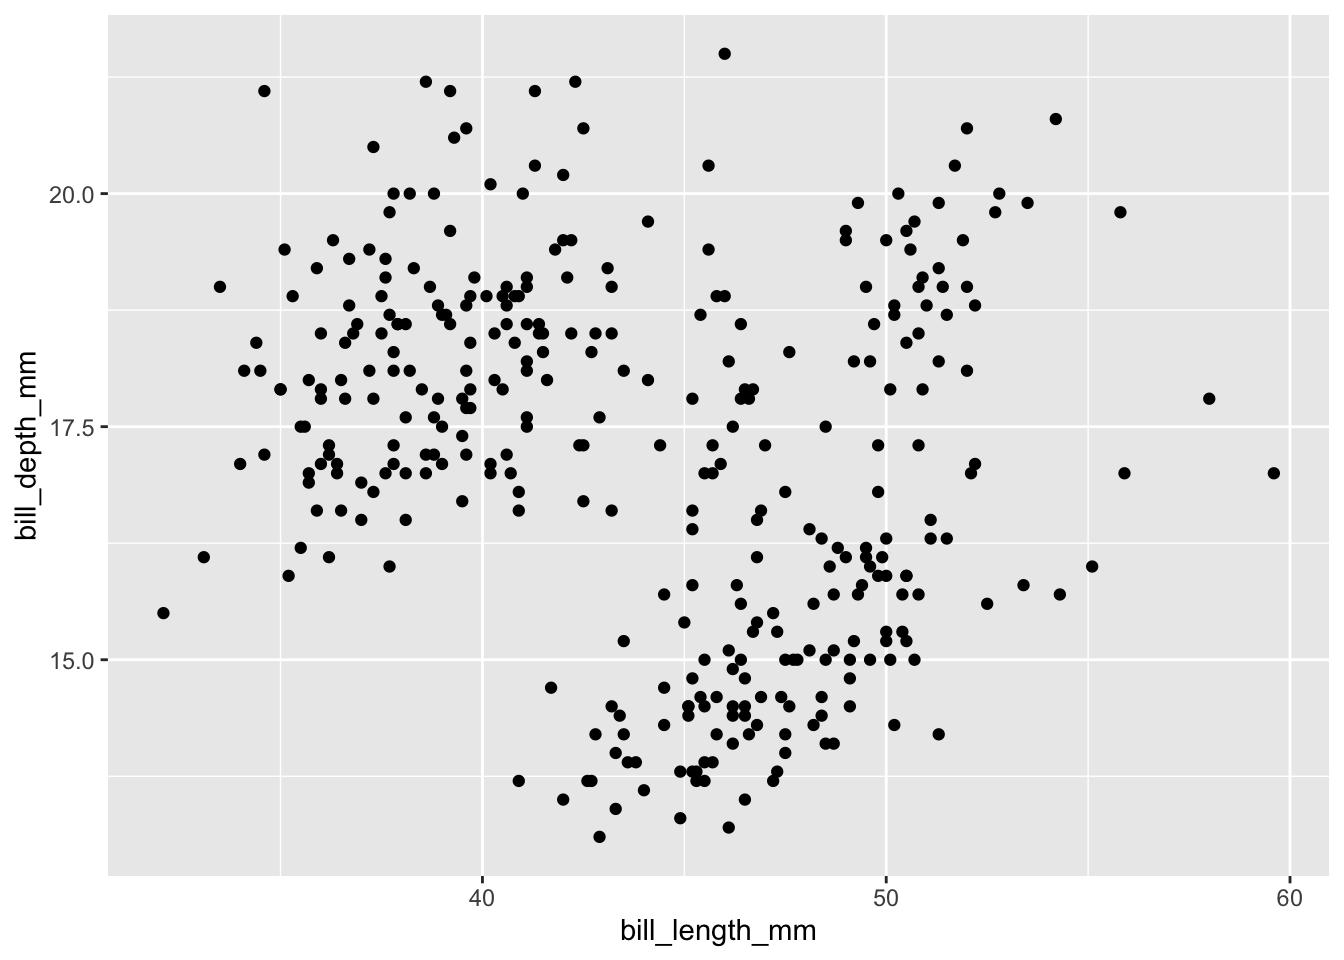
- What happens if you make a scatterplot of species vs. bill_depth_mm? What might be a better choice of geom?
Solution:
Code
Warning: Removed 2 rows containing missing values or values outside the scale range
(`geom_point()`).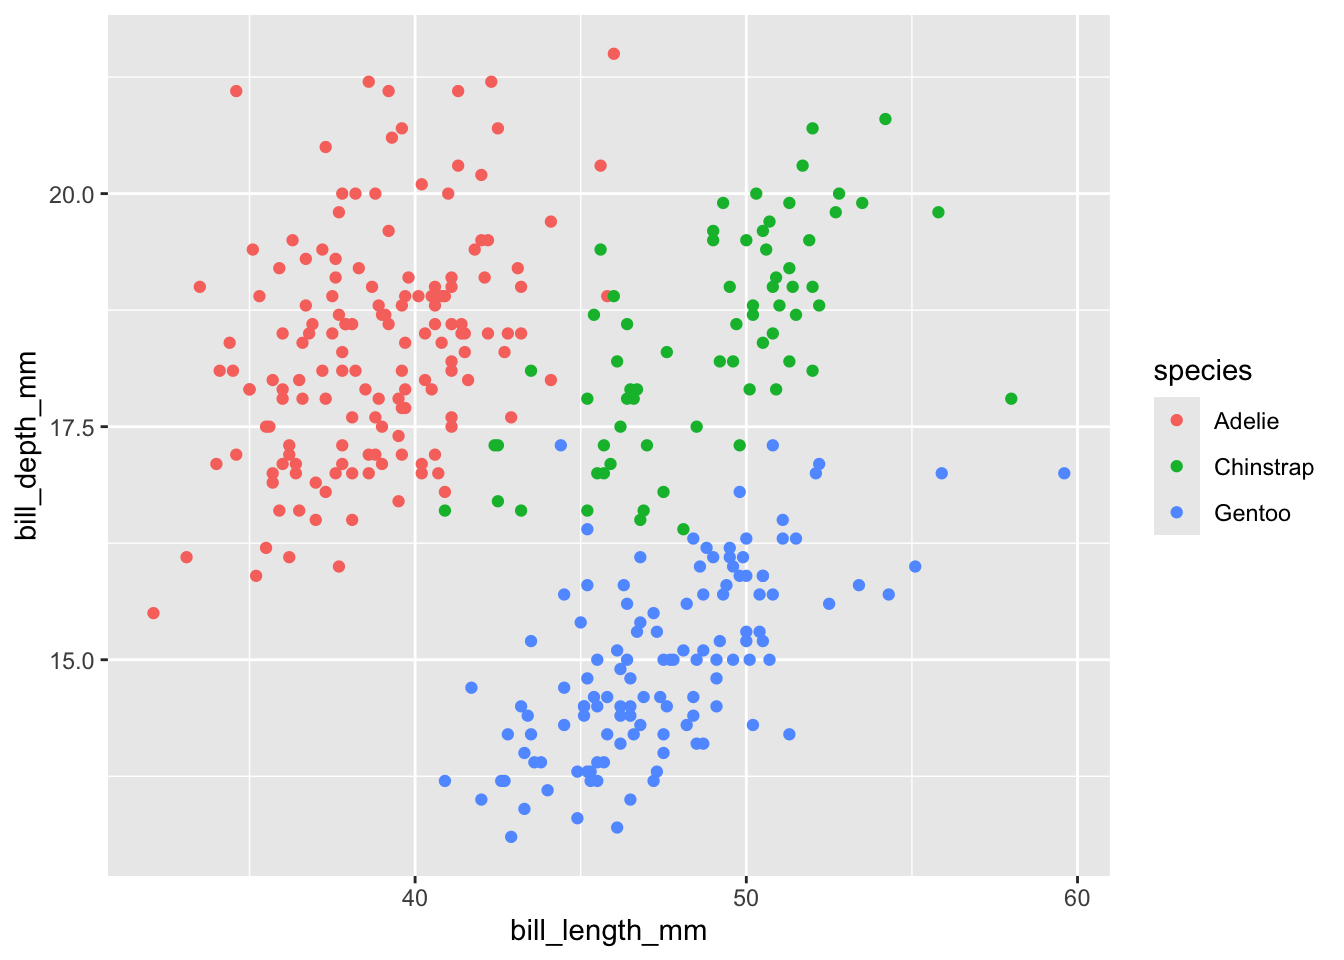
- Will these two graphs look different? Why/why not?
Code
`geom_smooth()` using method = 'loess' and formula = 'y ~ x'Warning: Removed 2 rows containing non-finite outside the scale range
(`stat_smooth()`).Warning: Removed 2 rows containing missing values or values outside the scale range
(`geom_point()`).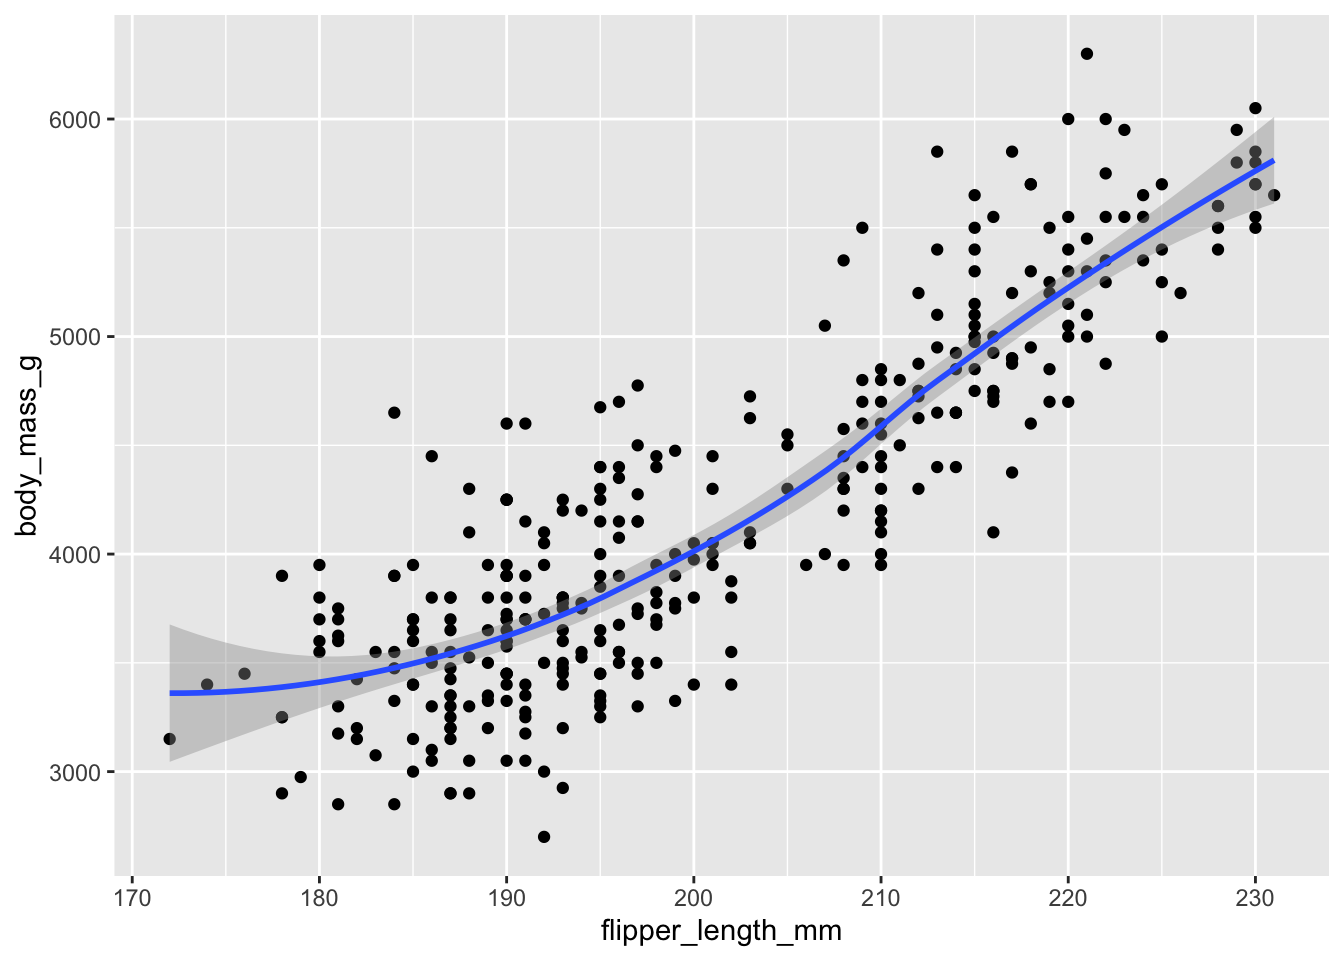
qnx |> |> |> ggplot() + geom_point( data = penguins, mapping = aes(x = flipper_length_mm, y = body_mass_g) ) + geom_smooth( data = penguins, mapping = aes(x = flipper_length_mm, y = body_mass_g) )