R programming for beginners (GV900)
Lesson 12: Confidence intervals
Sunday, January 14, 2024
Video of Lesson 12
1 Setup
In this lesson, we will learn Confidence intervals.
First, load the packages we will use in this lesson.
2 Standard Error
- We have learned that the standard error of a sample is calculated as follows:
- With standard error, we can calculate the confidence interval.
3 Confidence Interval
Confidence Interval
Confidence Intrval is a range of values that is likely to contain the population parameter with a certain degree of confidence.
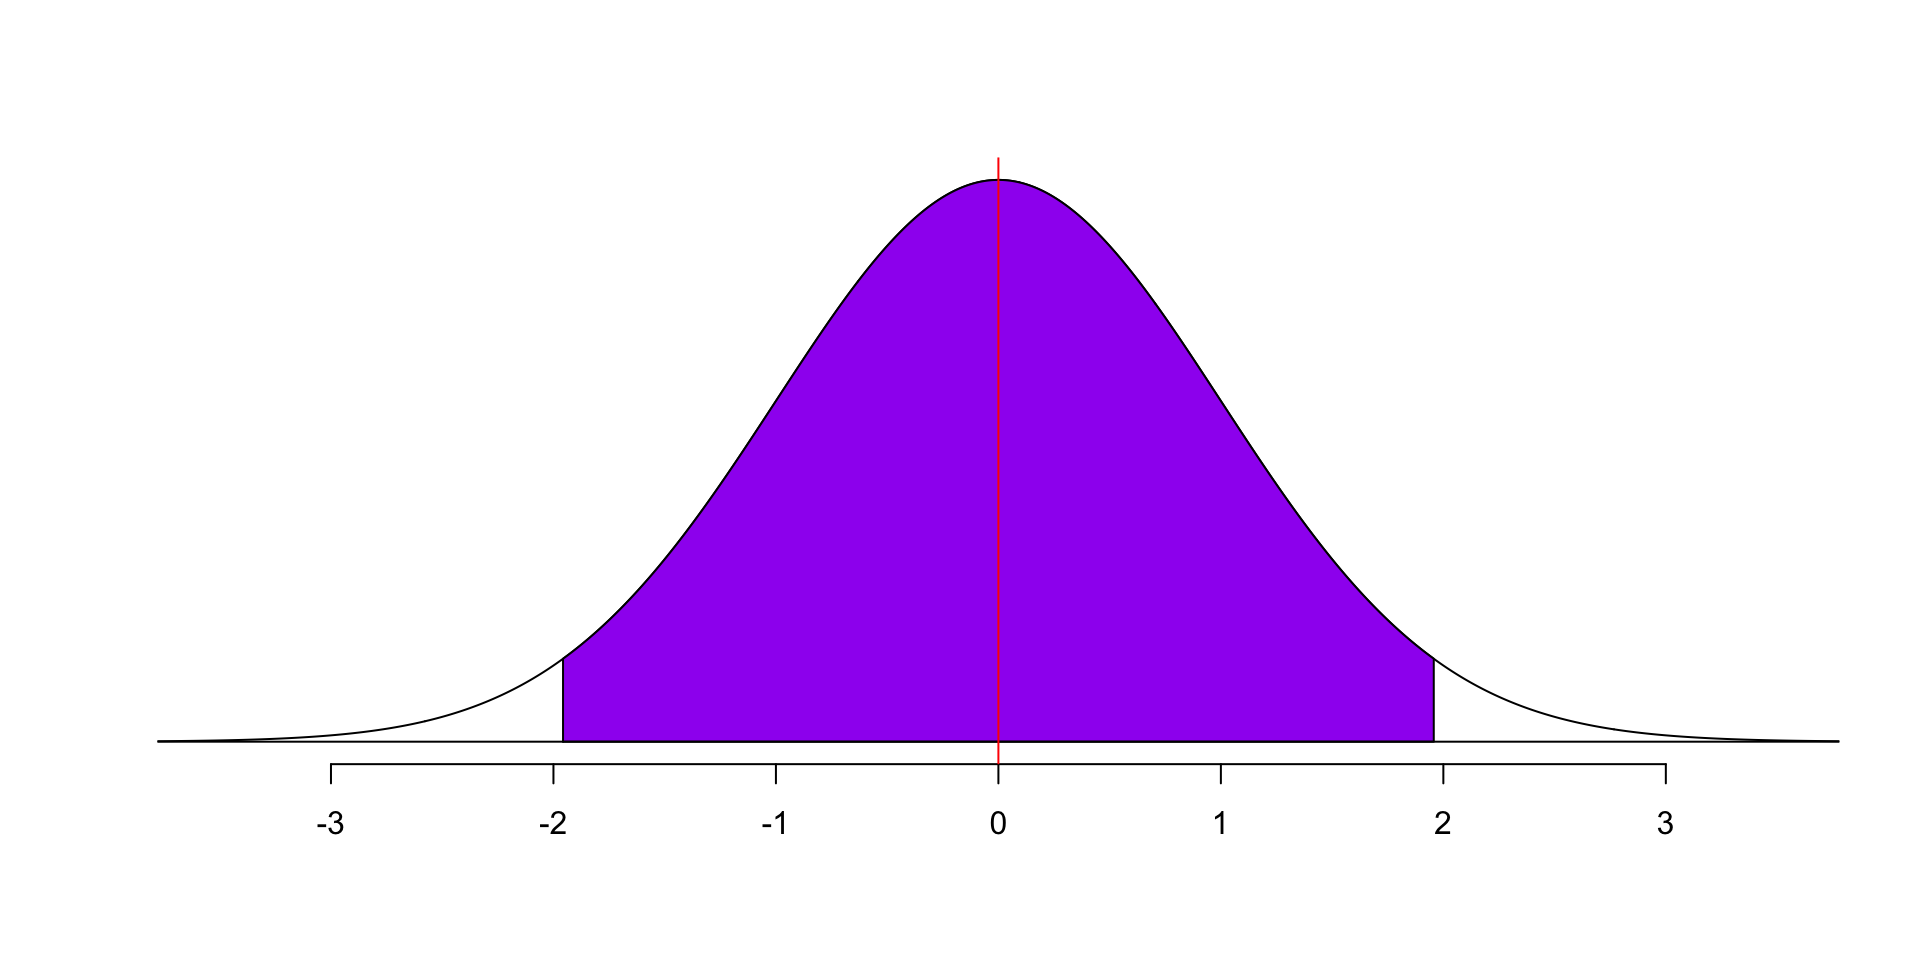
- The 95% confidence interval is calculated as follows:
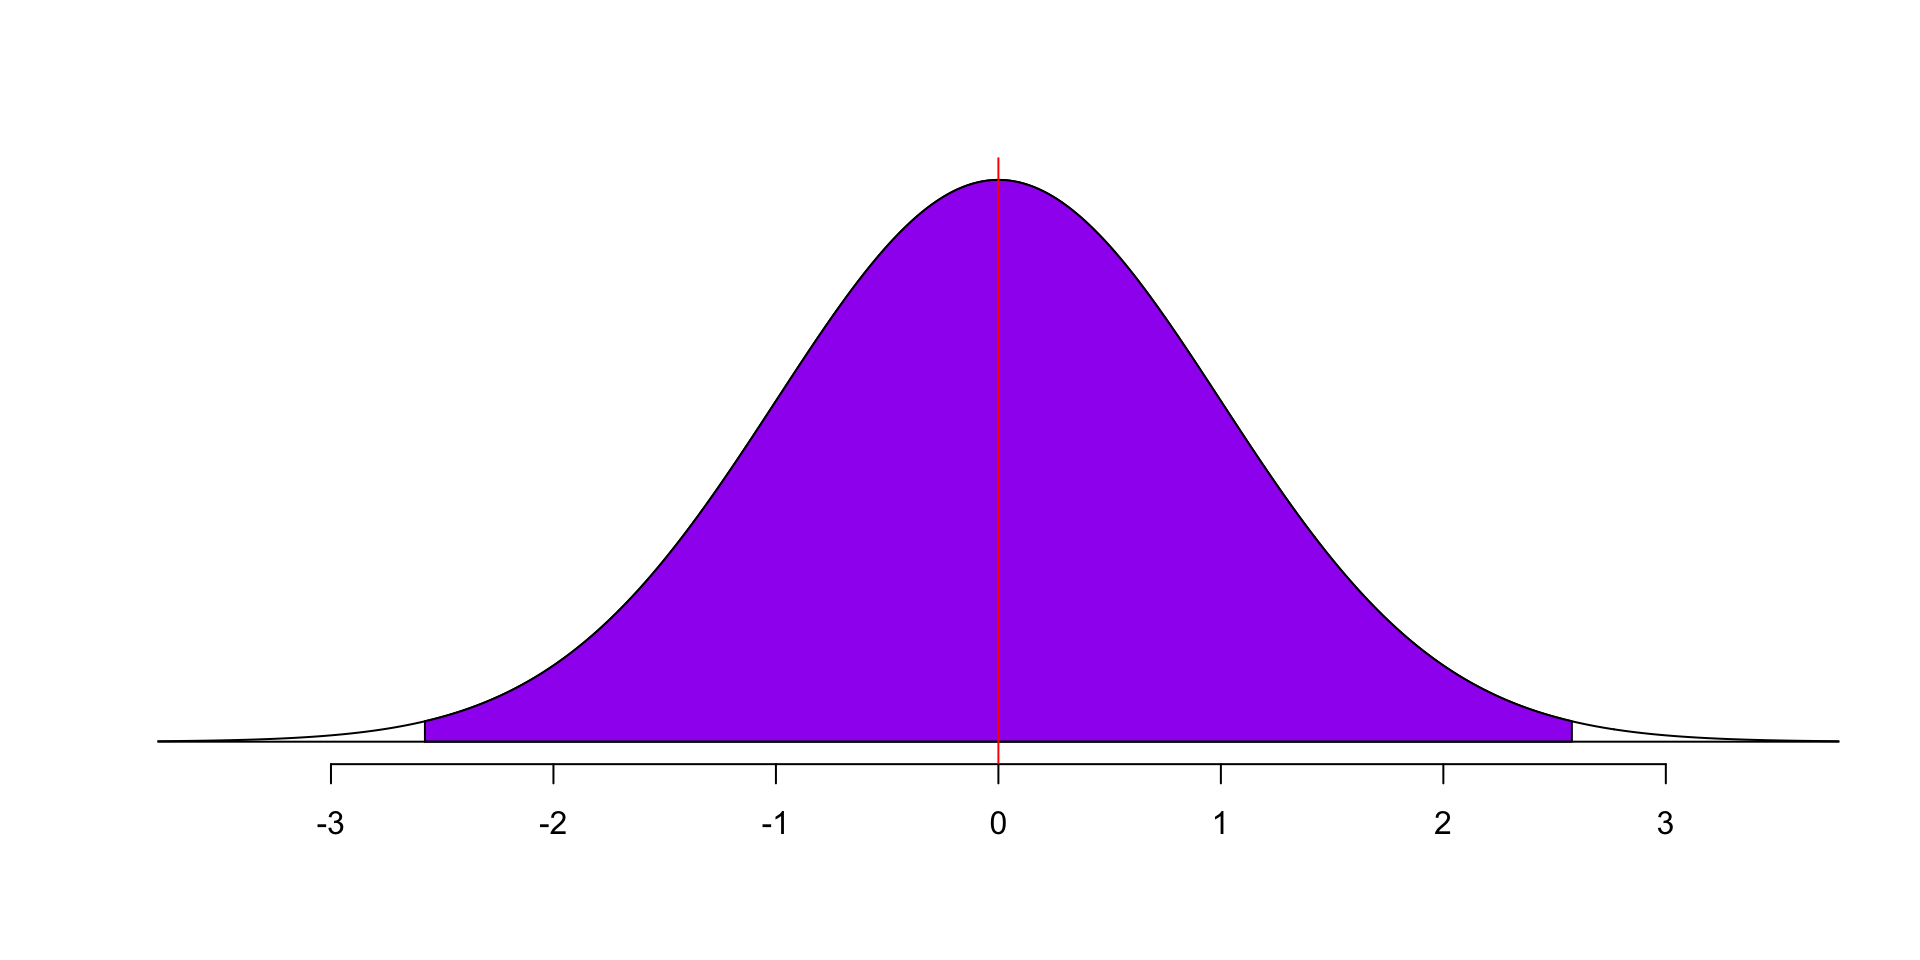
- The 99% confidence interval is calculated as follows:
4 Example
We use BEPS data to calculate the confidence interval of the average age of the population age.
Here we assume that the whole data set is the population.
- The 95% confidence interval is calculated as follows:
95% confidence interval is: [ 51.65743 , 57.60257 ]In this example, we say that we are 95% confident that the interval [51.6574273 and 57.6025727] covers the population mean age.
Which is true in this case, because the population mean age is 54.1822951.

- The 99% confidence interval is calculated as follows:
99% confidence interval is: [ 50.71712 , 58.54288 ]
In this example, we say that we are 99% confident that the interval [50.7171237 and 58.5428763] covers the population mean age.
Which, of course, is also true in this case, because the 99% confidence interval is wider than the 95% confidence interval.
However, in this case we assume the population mean age is 54.1822951, which is just a sample mean of the whole population.
In reality, we do not know the population mean age. So let’s estimate the population mean age with the sample
- The 95% confidence interval is calculated as follows:
95% confidence interval is: [ 53.39374 , 54.97085 ]In this example, we say that we are 95% confident that the interval [53.3937423 and 54.9708478] covers the population mean age.
In this case, we don’t know the population mean age, so we cannot say whether the interval actually covers the population mean age or not. But we are 95% confident that it does. Still, there are 5% chance that it does not.
Normally, we use 95% confidence interval, but we can also use 99%, or 90% confidence interval.
Which level to use depends on the situation. If we want to be more confident but less accurate, we use 99% confidence interval. If we want to be less confident but more accurate, we use 90% confidence interval.
Which means, confidence interval is a trade-off between confidence and accuracy.
It’s analogous to an archer aiming at a target. If the goal is for the archer to hit anywhere on the dartboard, their confidence may be high, around 99%. However, the arrow could land precisely in the bull’s eye or just at the edge of the dartboard. On the other hand, if the objective is to hit the bull’s eye specifically, the archer might feel less confident, perhaps only 90%.

5 Recap
Confidence interval is a range of values that is likely to contain the population parameter with a certain degree of confidence.
The 95% confidence interval is calculated as follows:
In this lesson, we assume we know the population standard deviation. So we use the z-score to calculate the confidence interval.
In t-test lesson, we will learn how to calculate the confidence interval when we don’t know the population standard deviation.
Thank you!