R教学课件
2023-09-07
1 Setup
This code computes the answer to one plus one, change it so it computes two plus two:
2 Slide one
2 Slide one

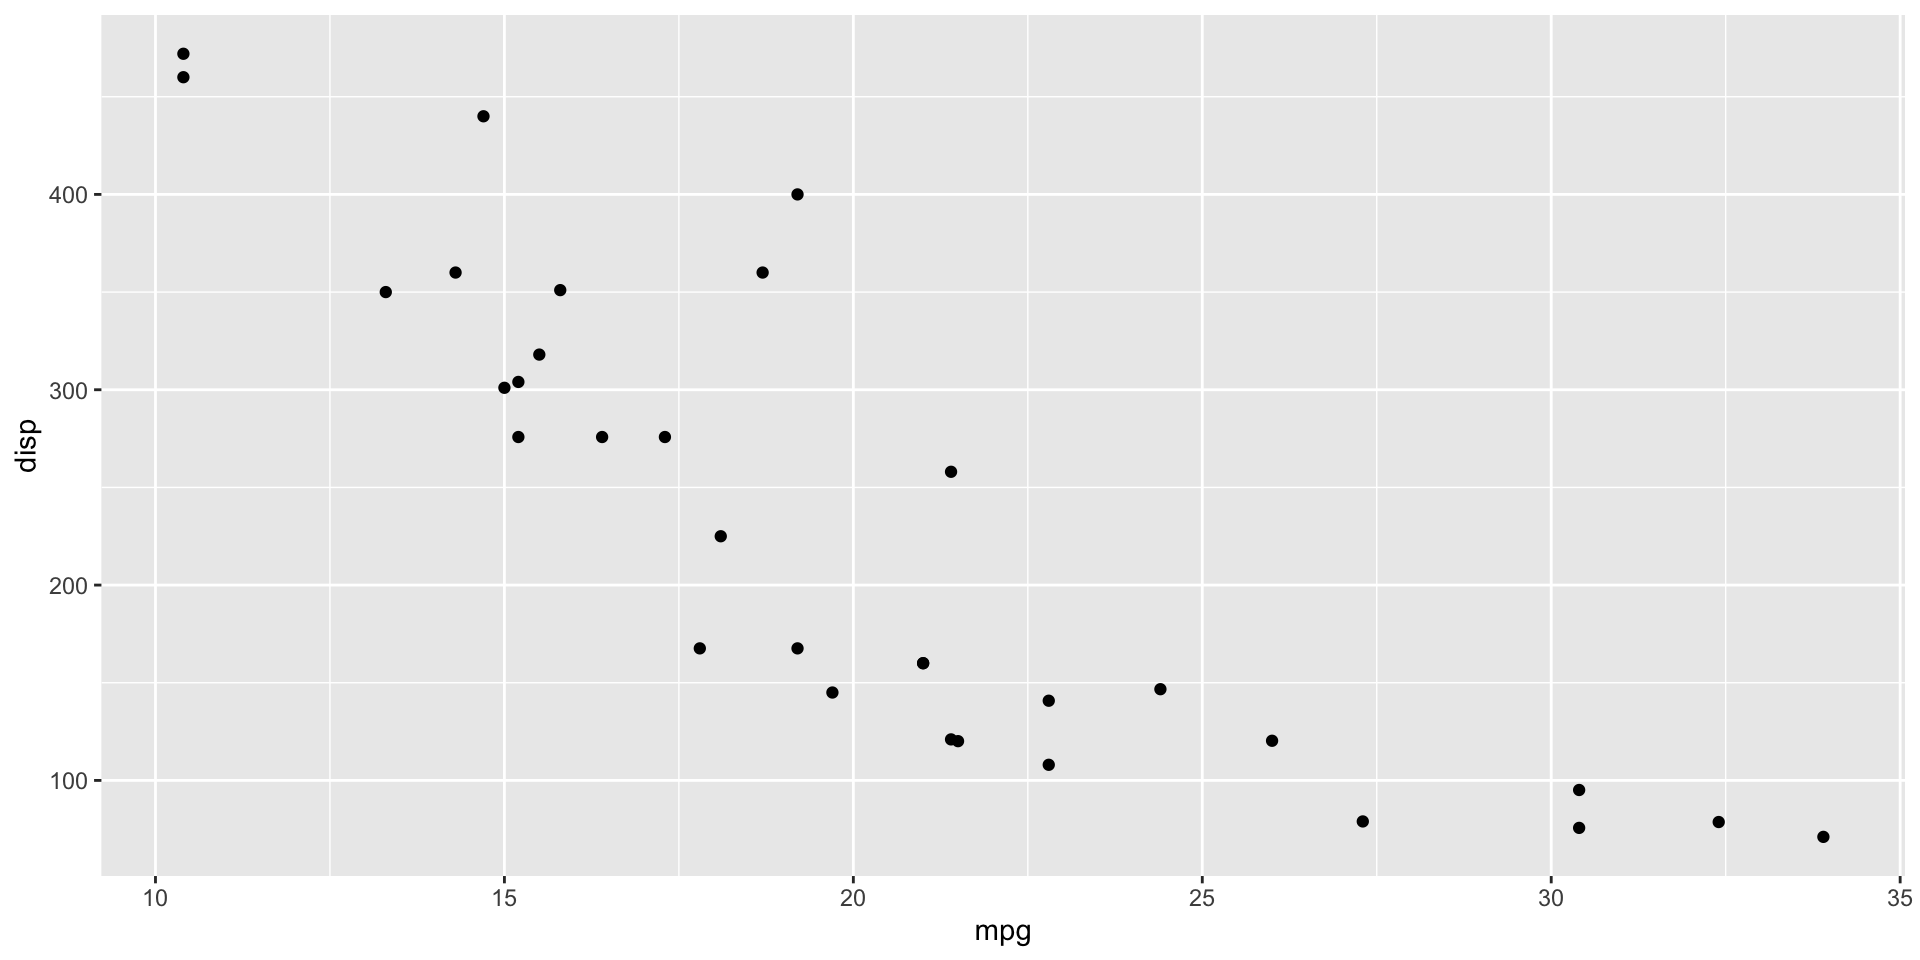
2.1 mtcars second
2.1 mtcars second
3 Slide two
3 Slide two

4 Slide three
4 Slide three

5 Slide four
5 Slide four

6 Video Slide
7 End
Thank you!


R教学课件 Reddy Lee 2023-09-07