Example. Freshman undergraduate enrollments at U.S. colleges have an approximate log-normal distribution with parameters mean = 6.1 and sd = 1.0. ### What is the probability that a randomly-selected college enrolls between 500 and 1000 freshmen in a year?
代码
plnorm(1000,6.1,1)-plnorm(500,6.1,1)
[1] 0.2447621
5.1 What is the 99th percentile for U.S. college enrollment?
代码
qlnorm(0.99,6.1,1)
[1] 4565.795
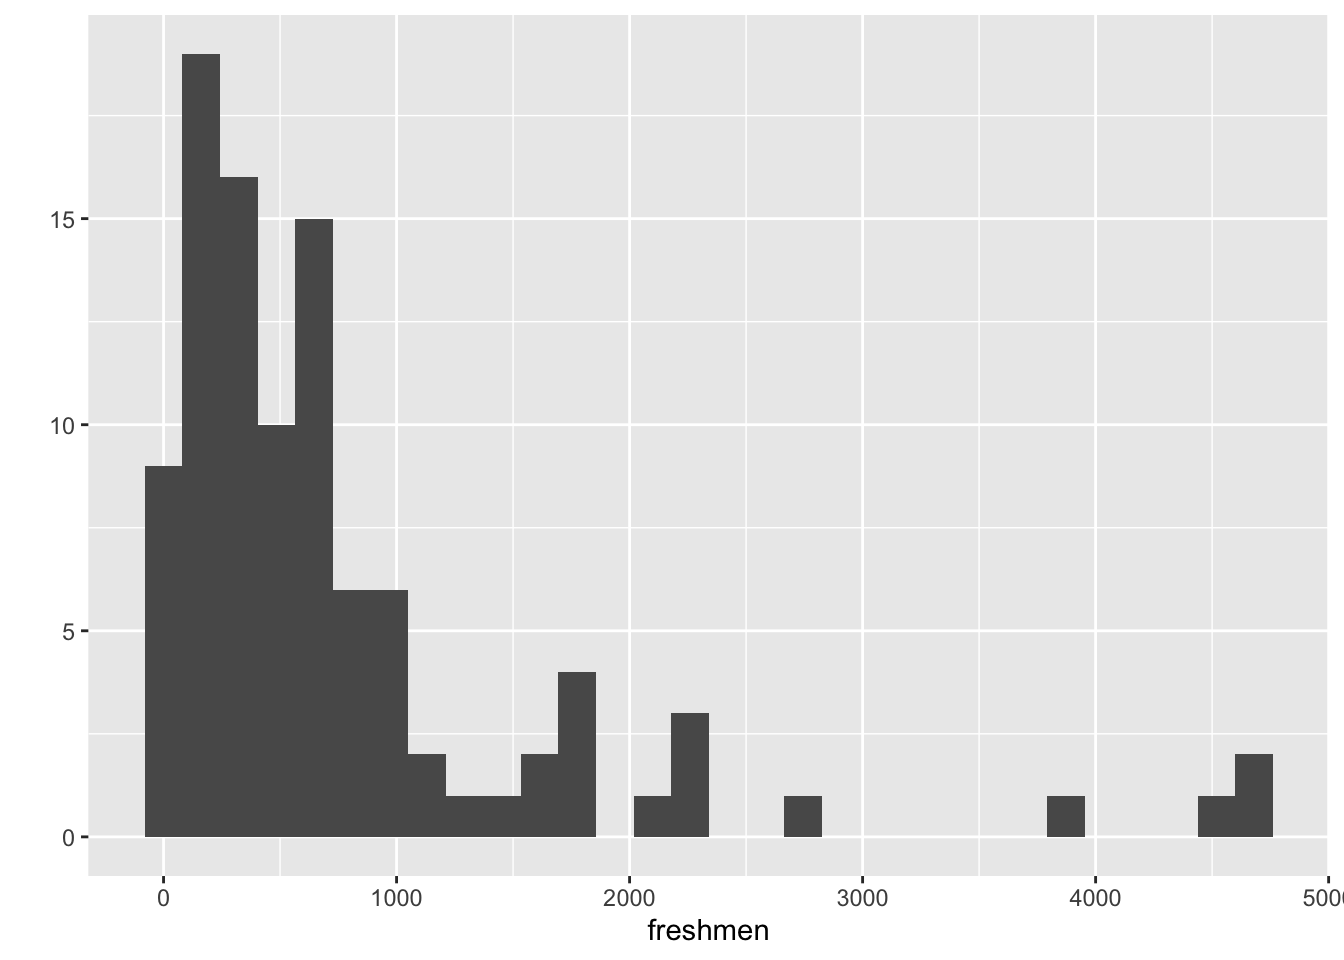
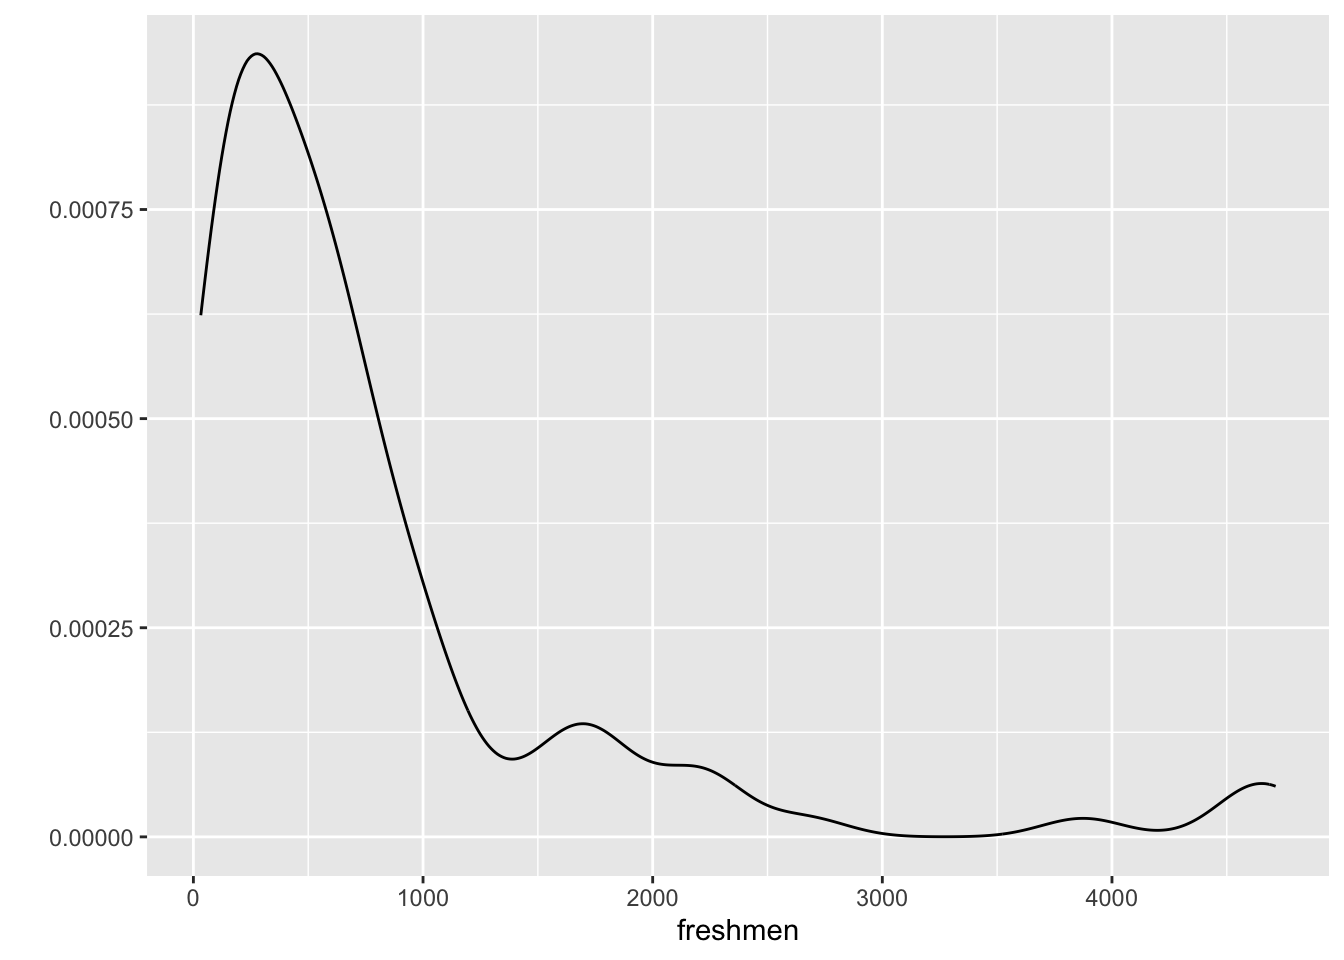
5.2 Simulate selecting 100 colleges at random. Plot a histogram of freshman enrollments at those colleges.
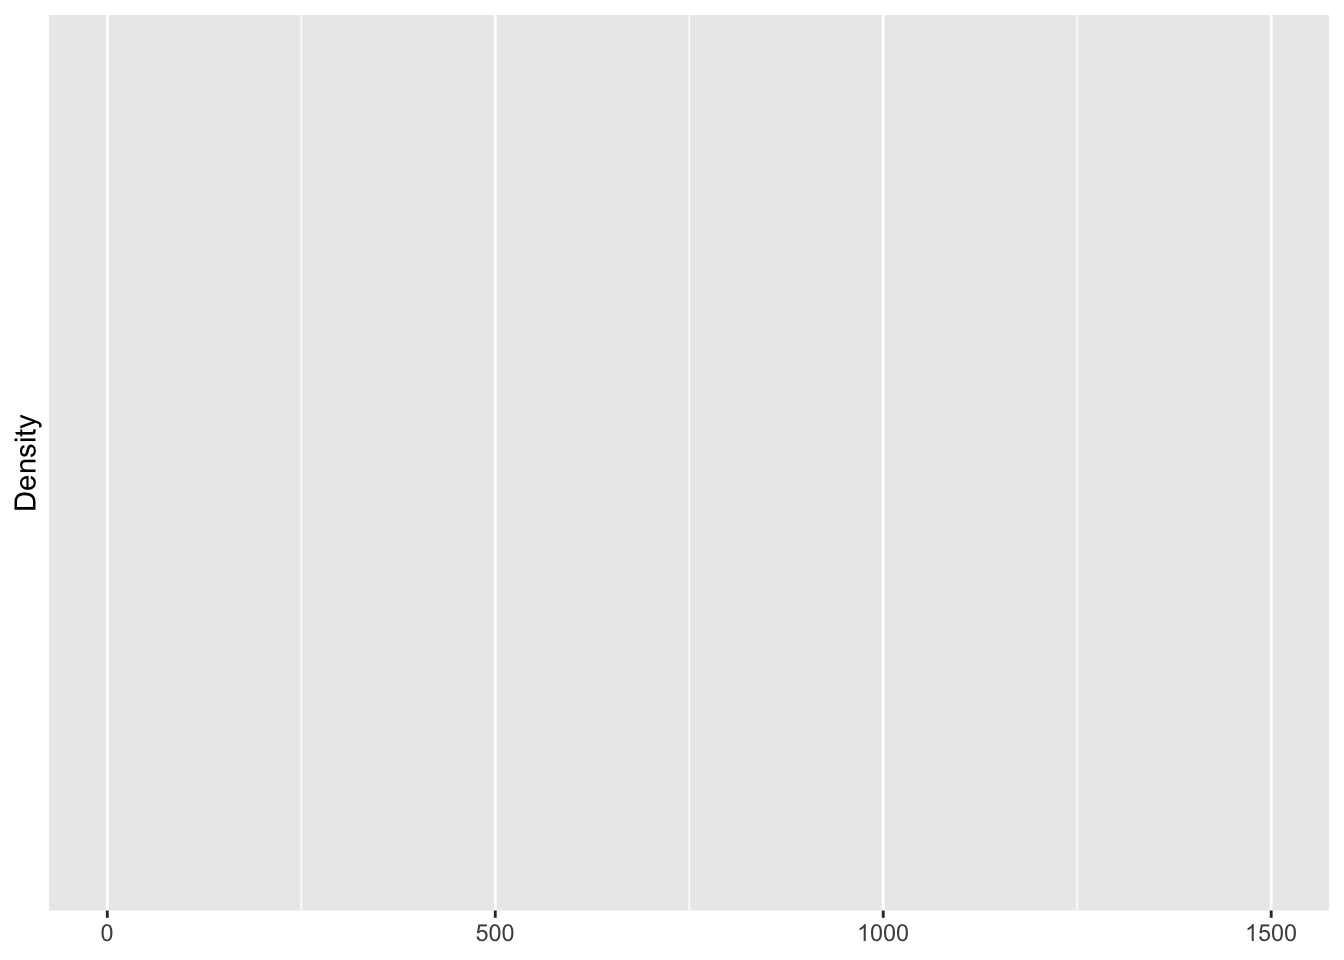
---title: Log-Normal calculations using Rsubtitle: 对数正太分布author: Reddy Leedate: "2023-11-06"date-format: fulldate-modified: last-modifiedformat: html: code-fold: show code-overflow: wrap code-line-numbers: true code-link: true code-tools: source: true toggle: true highlight-style: atom-one number-sections: trueexecute: echo: true message: false warning: falsecategories: [R, packages]lightbox: match: auto effect: fade desc-position: bottom loop: truepage-layout: articlemargin-header: | {width="38.2%"}-------```{r}#| label: setuplibrary(tidyverse)```对数正态分布数据是指对数据取对数后,数据呈正态分布的数据模型。和正态分布一样,对数正态分布也有两个基本的参数:$\sigma$ 和$\mu$。用R计算对数正态分布有4个基本的函数。## 随机生成对数正态分布数据: rlnorm(n,meanlg,sdlg)```{r}x <-rlnorm(120,6.1,1.0)```## 计算累积概率: plnorm(q,meanlg,sdlg)```{r}plnorm(717,6.1,1.0)plnorm(831,6.1,1.0)plnorm(c(717,744,831),6.1,1.0)```## 计算临界值: qlnorm(p,meanlg,sdlg)```{r}qlnorm(0.6956889,6.1,1.0)qlnorm(c(0.6826335, 0.6956889, 0.7332361),6.1,1.0)```## pdf值: dlnorm(x,meanlg,sdlg)```{r}dlnorm(0.6956889,6.1,1)``````{r}ggplot()+geom_function(fun=dlnorm,args=list(mena=6.1,sd=1.0))+xlim(0,1500)+labs(y="Density")```## 练习Example. Freshman undergraduate enrollments at U.S. colleges have anapproximate log-normal distribution with parameters mean = 6.1 and sd = 1.0.### What is the probability that a randomly-selected college enrolls between 500 and 1000 freshmen in a year?```{r}plnorm(1000,6.1,1)-plnorm(500,6.1,1)```### What is the 99th percentile for U.S. college enrollment?```{r}qlnorm(0.99,6.1,1)```### Simulate selecting 100 colleges at random. Plot a histogram of freshman enrollments at those colleges.```{r}freshmen <-rlnorm(100,6.1,1)qplot(freshmen,geom="histogram")qplot(freshmen,geom="density")```